
Pharse XML Files with Powershell and show results in a chart
Hallo zusammen,
Habe mir aufgrund des Eurotiefstands mal ein Powershell zur Anzeige des Eurokurses geschrieben.
Den Eurokurs gibts als XML zum Pharsen hier: http://www.ecb.europa.eu/stats/eurofxref/eurofxref-daily.xml
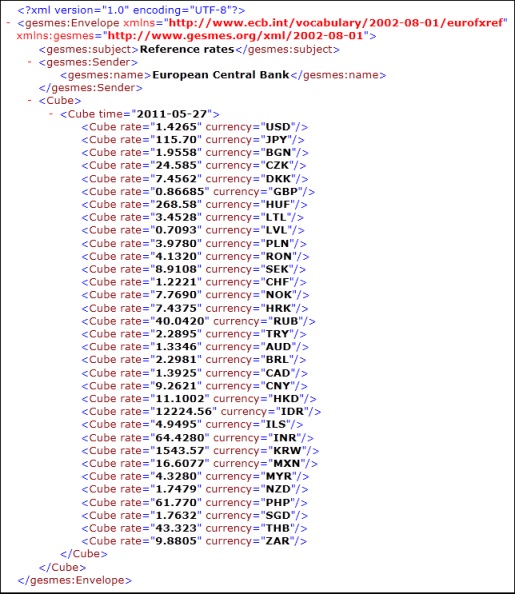
Schon cool, wie einfach es ist XML Files mit Powershell zu pharsen.
$xml.Load('http://www.ecb.europa.eu/stats/eurofxref/eurofxref-daily.xml')
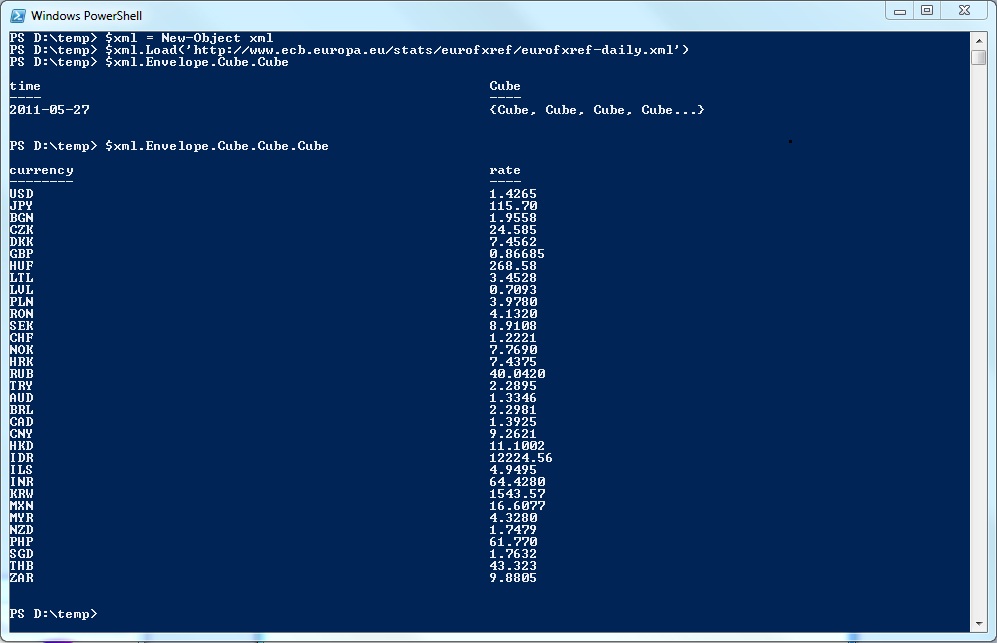
Das ganze kann in ein Array ($allrates) gepackt werden und dann ausgewertet werden
$xml = New-Object xml
$xml.Load('http://www.ecb.europa.eu/stats/eurofxref/eurofxref-daily.xml')
$allrates = @{}
$xml.Envelope.Cube.Cube.Cube | ForEach {
$currency = $_.currency;
$rate = $_.rate;
$allrates.$currency = $rate
}
$datum = $xml.Envelope.Cube.Cube.time
Write-Host "Datum:" $datum
write-Host "All exchange rates:"
$allrates
write-Host "Specific exchange rate CHF:" $allrates["CHF"]
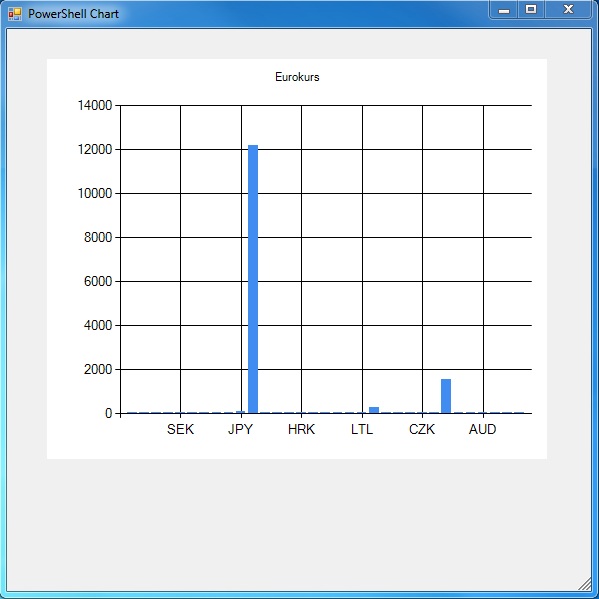
Oder man lädt sich die Microsoft Chart Controls for Microsoft .NET Framework 3.5 herunter und lässt die Wechselkurse in einem Chart darstellen.
# load the appropriate assemblies
[void][Reflection.Assembly]::LoadWithPartialName("System.Windows.Forms")
[void][Reflection.Assembly]::LoadWithPartialName("System.Windows.Forms.DataVisualization")
# create chart object
$Chart = New-object System.Windows.Forms.DataVisualization.Charting.Chart
$Chart.Width = 500
$Chart.Height = 400
$Chart.Left = 40
$Chart.Top = 30
# create a chartarea to draw on and add to chart
$ChartArea = New-Object System.Windows.Forms.DataVisualization.Charting.ChartArea
$Chart.ChartAreas.Add($ChartArea)
Microsoft Chart Controls for Microsoft .NET Framework 3.5
# add data to chart
[void]$Chart.Series.Add("Data")
$Chart.Series["Data"].Points.DataBindXY($allrates.Keys, $allrates.Values)
# display the chart on a form
$Chart.Anchor = [System.Windows.Forms.AnchorStyles]::Bottom -bor
[System.Windows.Forms.AnchorStyles]::Right -bor
[System.Windows.Forms.AnchorStyles]::Top -bor
[System.Windows.Forms.AnchorStyles]::Left
$Chart.Titles.Add("Eurokurs")
$Form = New-Object Windows.Forms.Form
$Form.Text = "PowerShell Chart"
$Form.Width = 600
$Form.Height = 600
$Form.controls.add($Chart)
$Form.Add_Shown({$Form.Activate()})
$Form.ShowDialog()
![]()